Python - GUI - Tkinter(Bar & Pie Chart)
Quickly, i just want to show you a simple example of creating bar and pie chart with Tkinter.
Try this simple example:
import tkinter as tk
root = tk.Tk()
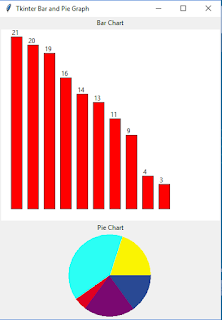
root.title("Tkinter Bar and Pie Graph")
#here is for bar chart............
tk.Label(root, text='Bar Chart').pack()
data = [21, 20, 19, 16, 14, 13, 11, 9, 4, 3]
c_width = 400
c_height = 350
c = tk.Canvas(root, width=c_width, height=c_height, bg= 'white')
c.pack()
#experiment with the variables below size to fit your needs
y_stretch = 15
y_gap = 20
x_stretch = 10
x_width = 20
x_gap = 20
for x, y in enumerate(data):
# calculate reactangle coordinates
x0 = x * x_stretch + x * x_width + x_gap
y0 = c_height - (y * y_stretch + y_gap)
x1 = x * x_stretch + x * x_width + x_width + x_gap
y1 = c_height - y_gap
# Here we draw the bar
c.create_rectangle(x0, y0, x1, y1, fill="red")
c.create_text(x0+2, y0, anchor=tk.SW, text=str(y))
#here is for pie chart............
#create function
def prop(n):
return 360.0 * n / 1000
tk.Label(root, text='Pie Chart').pack()
c = tk.Canvas(width=154, height=154)
c.pack()
c.create_arc((2,2,152,152), fill="#FAF402", outline="#FAF402", start=prop(0), extent = prop(200))
c.create_arc((2,2,152,152), fill="#2BFFF4", outline="#2BFFF4", start=prop(200), extent = prop(400))
c.create_arc((2,2,152,152), fill="#E00022", outline="#E00022", start=prop(600), extent = prop(50))
c.create_arc((2,2,152,152), fill="#7A0871", outline="#7A0871", start=prop(650), extent = prop(200))
c.create_arc((2,2,152,152), fill="#294994", outline="#294994", start=prop(850), extent = prop(150))
root.mainloop()
root = tk.Tk()
root.title("Tkinter Bar and Pie Graph")
#here is for bar chart............
tk.Label(root, text='Bar Chart').pack()
data = [21, 20, 19, 16, 14, 13, 11, 9, 4, 3]
c_width = 400
c_height = 350
c = tk.Canvas(root, width=c_width, height=c_height, bg= 'white')
c.pack()
#experiment with the variables below size to fit your needs
y_stretch = 15
y_gap = 20
x_stretch = 10
x_width = 20
x_gap = 20
for x, y in enumerate(data):
# calculate reactangle coordinates
x0 = x * x_stretch + x * x_width + x_gap
y0 = c_height - (y * y_stretch + y_gap)
x1 = x * x_stretch + x * x_width + x_width + x_gap
y1 = c_height - y_gap
# Here we draw the bar
c.create_rectangle(x0, y0, x1, y1, fill="red")
c.create_text(x0+2, y0, anchor=tk.SW, text=str(y))
#here is for pie chart............
#create function
def prop(n):
return 360.0 * n / 1000
tk.Label(root, text='Pie Chart').pack()
c = tk.Canvas(width=154, height=154)
c.pack()
c.create_arc((2,2,152,152), fill="#FAF402", outline="#FAF402", start=prop(0), extent = prop(200))
c.create_arc((2,2,152,152), fill="#2BFFF4", outline="#2BFFF4", start=prop(200), extent = prop(400))
c.create_arc((2,2,152,152), fill="#E00022", outline="#E00022", start=prop(600), extent = prop(50))
c.create_arc((2,2,152,152), fill="#7A0871", outline="#7A0871", start=prop(650), extent = prop(200))
c.create_arc((2,2,152,152), fill="#294994", outline="#294994", start=prop(850), extent = prop(150))
root.mainloop()
Final display:

Inetsoft is a data integration platform. It is a cloud-based solution that will bring all your data sources together.
ReplyDeleteThank you for sharing your thoughts on this. I found myself nodding along as I read, and it sparked some interesting ideas in my own mind. A truly valuable contribution to the online conversation
ReplyDeleteHow to Reach Dharamshala Himachal Pradesh
Goa Tour Package from Delhi
ReplyDeleteGoa Tour Packages for 4 Persons
Goa Packages with Flight from Delhi
The combination of Python programming and visual data representation shown in the article is highly relevant to Python Projects For Final Year. Building interactive applications with charts and graphical interfaces helps developers create more user-friendly solutions while strengthening their understanding of programming concepts and data visualization techniques.
ReplyDeleteLearning to develop GUI-based applications with Tkinter is a valuable skill for students and professionals alike. Those interested in expanding their expertise in Python application development, automation, and visualization can benefit from Python Training Courses, which provide practical experience with real-world Python programming projects.